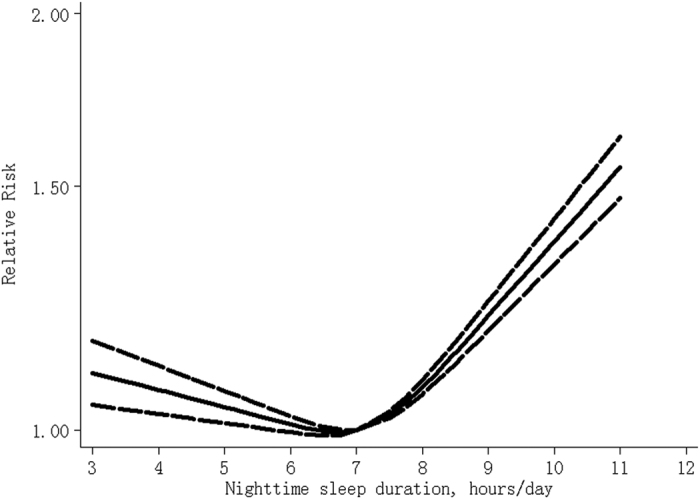
Figure 1. The dose-response analysis between nighttime sleep duration and risk of all-cause mortality.

The solid line and the long dash line represent the estimated relative risk and its 95% confidence interval.

The solid line and the long dash line represent the estimated relative risk and its 95% confidence interval.