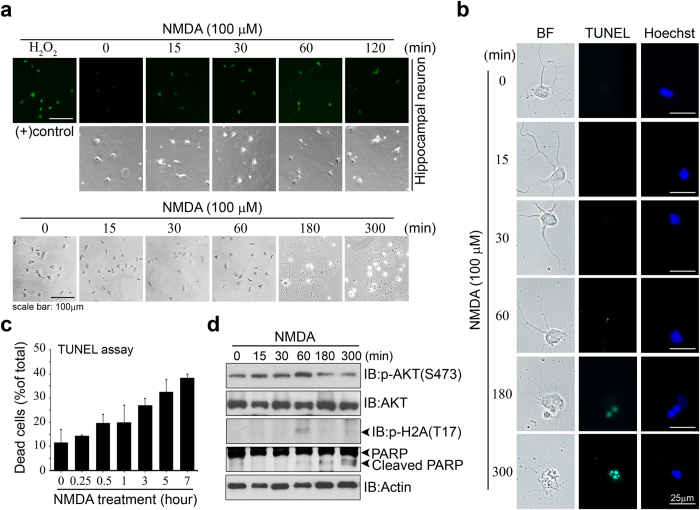
Figure 5. NMDA excitotic cell death reflects H2O2 mediated Akt/H2A signaling.
(a) Hippocampal neuron cells were treated with 100 μM NMDA for 0 to 2 hours. Afterwards, cells were incubated with CM-H2DCFDA for measuring H2O2 production. Cell image was obtained using a fluorescent microscope (upper). Cells were treated with H2O2 for 10min as positive control. Primary neuron cultures were treated with NMDA (100 μM) for 5 hours and representative digital image of cells are seen in the bottom of Fig. 5a. Scale bar, 100 μm.(b) Primary hippocampal neurons were stained with TUNEL (green) after NMDA treatment for the indicated time. Scale bar, 25 μm. (c) Apoptotic cells measured by TUNEL assay are presented in the bar graph. (d) Primary cultured hippocampal neurons were treated NMDA (100 μM) and cell extracts were immunoblotted with indicated antibodies.

