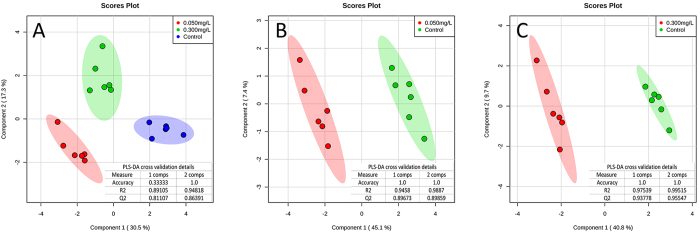
Figure 1. Score plots of PLS-DA models.
PLS-DA analyses were performed using MetaboAnalyst 3.0. PLS-DA model among control and 0.050 and 0.300 mg/L TPhP-treated groups (A); PLS-DA model between control and 0.050 mg/L TPhP-treated groups (B); PLS-DA model between control and 0.300 mg/L TPhP-treated groups (C). The shaded areas are the 95% confidence regions of each treatment. Six parallel metabolomics samples were prepared in each treatment group.

