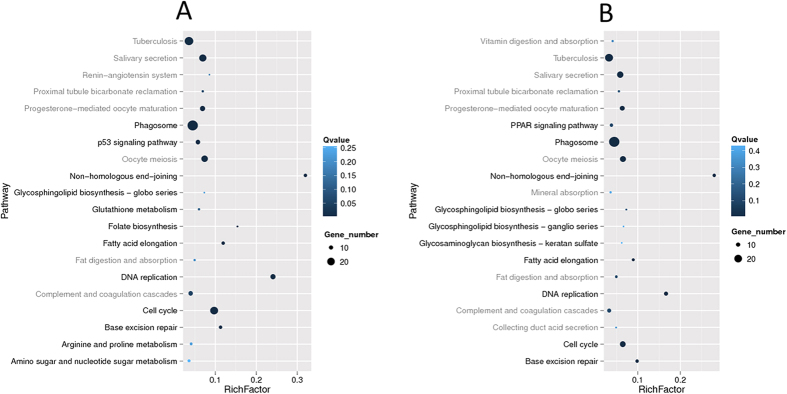
Figure 2. Top 20 influenced pathways of each TPhP-treated group in the transcriptomic analysis.
(A) Top 20 statistics of KEGG pathway enrichment for DEGs observed in the 0.050 mg/L TPhP-treated group; (B) Top 20 statistics of KEGG pathway enrichment for DEGs observed in the 0.300 mg/L TPhP-treated group.

