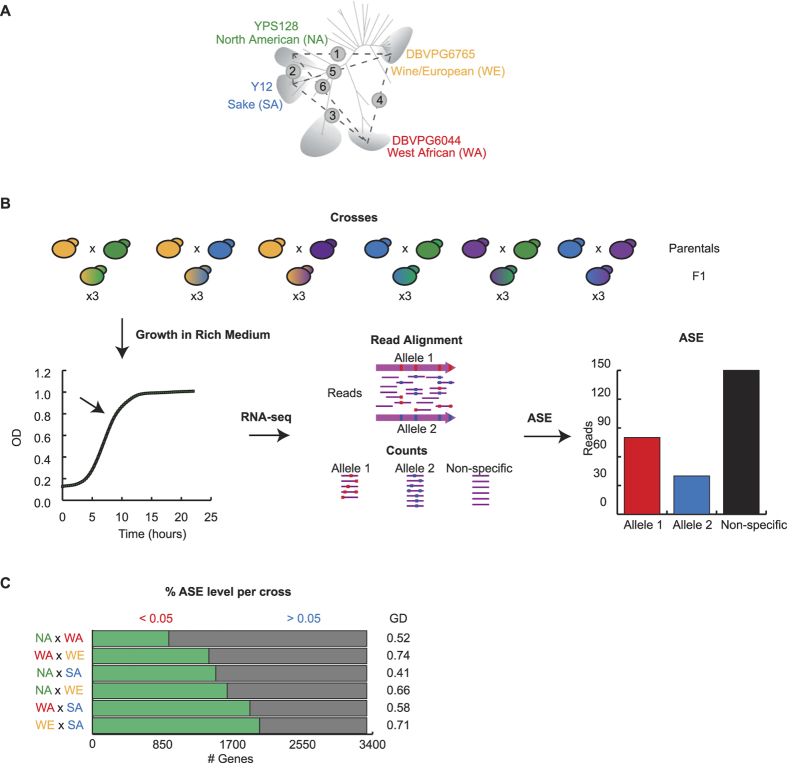
Figure 1. Allele-Specific Expression (ASE) between natural isolates.
(A) The schematic tree highlights the four major geographic clusters previously described25. The four isolates (NA, YPS128; SA, Y12; WA, DBVPG6044 and WE, DBVPG6765) used to generate the F1 hybrids utilised in this study comprise a large fraction of the genetic variation in the species. (B) Schematic diagram representing the strategy followed to estimate ASE in budding yeast. Six F1 crosses were grown in rich media (YPD) in triplicates for RNA-sequencing in an Illumina HiSeq2500 platform. Reads were aligned against both genomes and reads specifically aligning to either parental background were considered for ASE estimation. ASE was estimated as the log2 ratio between the number of reads per gene for each parental background (red and blue). Replicates were treated independently throughout the process and ASE was estimated using edgeR (C) ASE levels per cross are depicted based on significance levels. Significant (green, FDR < 5%) and non-significant genes (grey, FDR > 5%) are shown together with the genetic distance (GD as %) between the strains based on Liti et al., 2009.

