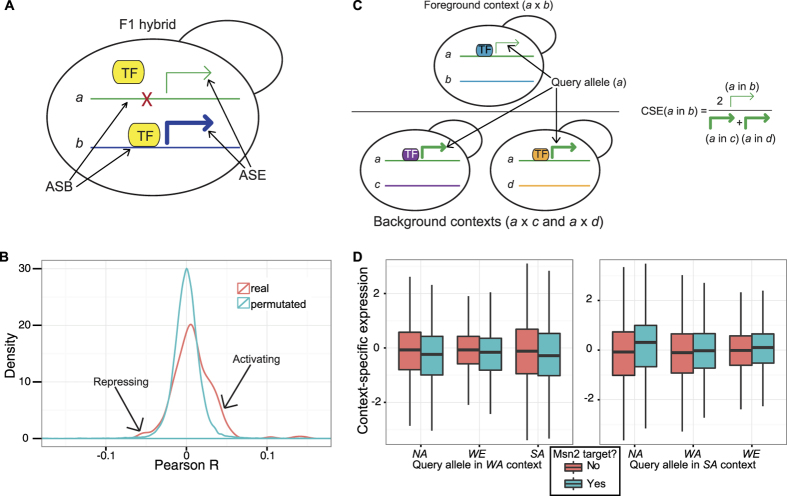
Figure 2. Motif analysis identifies mechanisms of ASE in both cis and trans.
(A) Predicting ASE by ASB. Differences in binding sites can result in differences in TF binding and, consequently, differences in expression level. (B) Observed and expected (by gene-label permutation) Pearson R distributions for ASB and ASE. Shoulders to the right and left indicate activating and repressing TFs, respectively. (C) Context-specific expression (CSE) concept. When the green allele (strain ‘a’) shares a nucleus with the blue genome (strain ‘b’), its expression (green arrow) is in part governed by the blue TFs. CSE of the green allele in the blue context is equal to the ratio of the allele’s expression when paired with the blue TFs and that allele’s expression when paired with the purple (strain ‘c’) and yellow (strain ‘d’) TFs (as a background). (D) CSE distributions for predicted Msn2 targets and non-targets in the trans-context of WA and SA strains.

