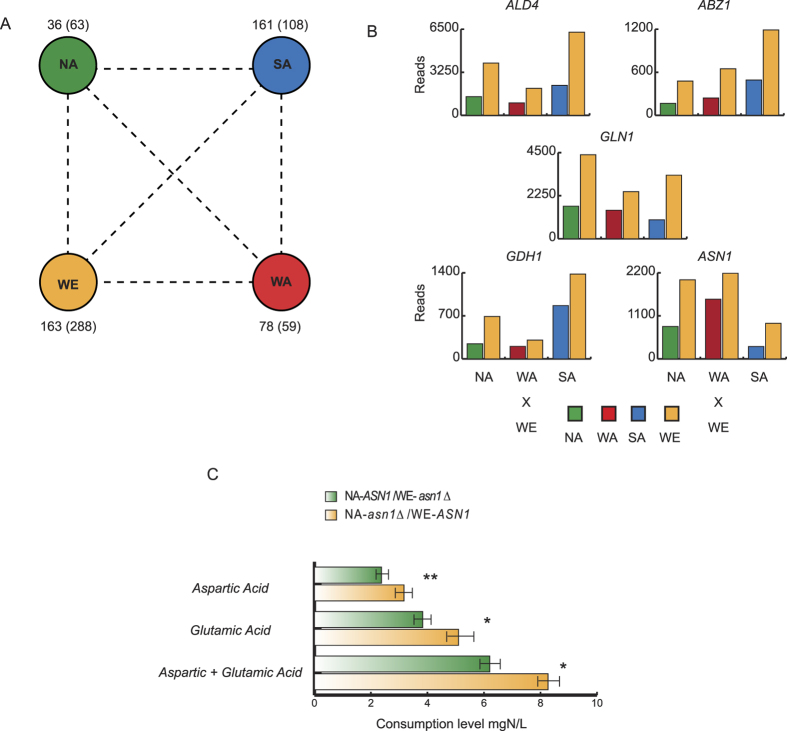
Figure 3. Directional Allelic Selection.
(A) Diagram representing the number of alleles maximally expressed and (minimally expressed) on each genetic background based on ASE levels (FDR < 5%) on the three hybrids where the corresponding parental strain is involved. (B) ASE levels in the set of maximally expressed alleles in the WE background for the ‘carboxylic acid biosynthetic process’ GO term. The number of reads for each allele in the three crosses involving the WE strain is shown for ALD4, ABZ1, GLN1, GDH1 and ASN1. (C) Amino Acid consumption levels (mgN/L) for aspartic acid, glutamic acid and the sum of both are depicted for NA-ASN1/WE- asn1Δ (green) and NA-asn1Δ/WE-ASN1 (orange) reciprocal hemizygotes. Significant differences were found for aspartic acid (p-value < 0.004), glutamic acid (p-value < 0.04) and the sum of both (p-value < 0.02).

