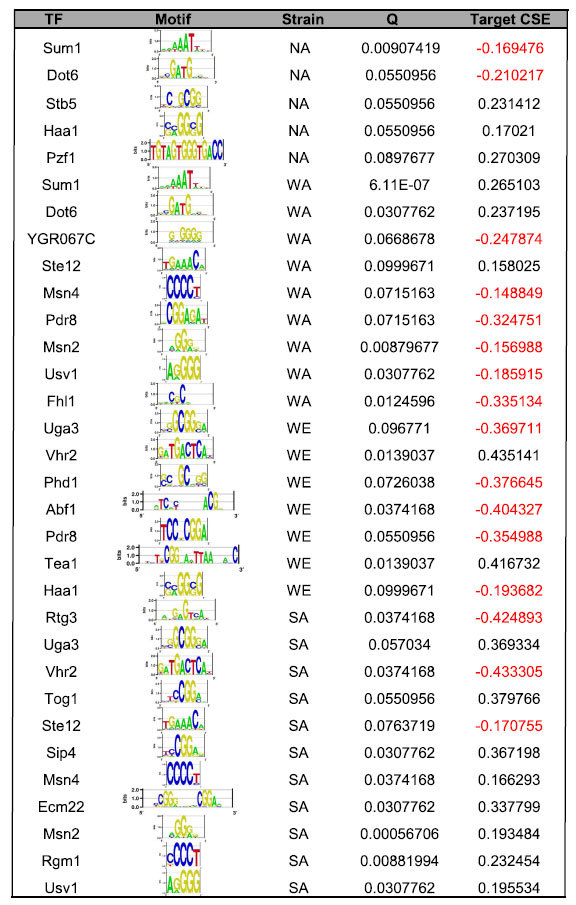
Table 1. TFs whose motif instances significantly predict CSE.

The TF, its recognition motif, and the strain showing the difference in trans-regulation are as indicated. Q and Target CSE represent, respectively, the FDR-corrected p-values and differences in means (CSETarget - CSENon-target) in the comparison of CSE values between TF targets and non-targets.
