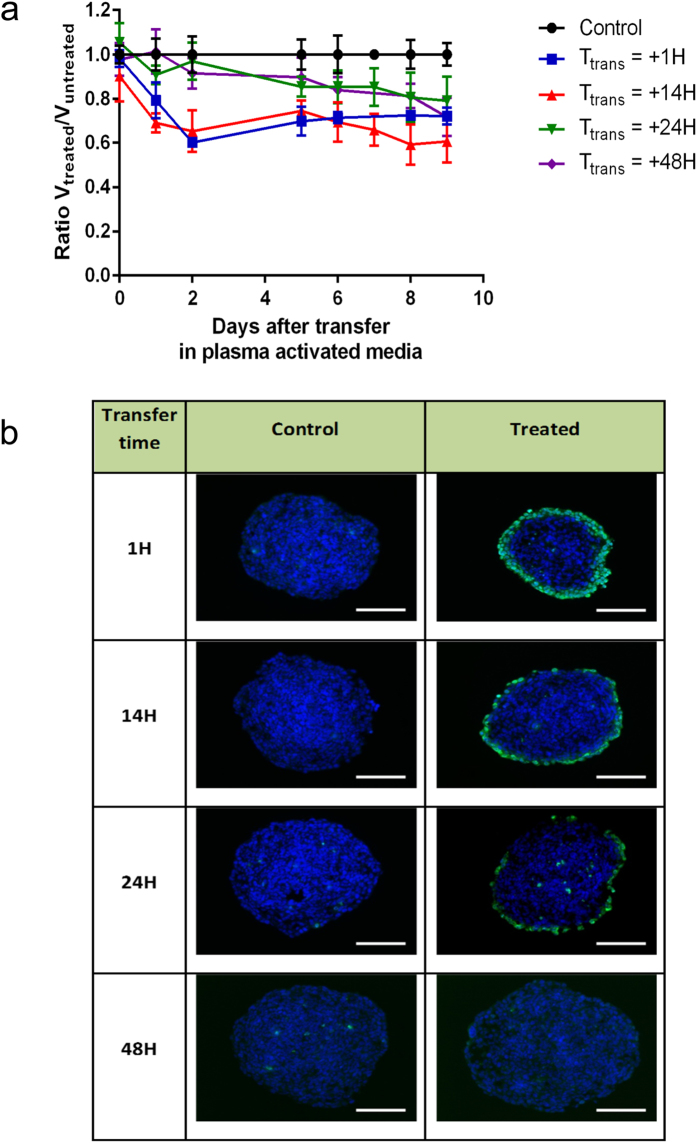
Figure 1. Growth inhibition and genotoxic effects of PAM on HCT116 MCTS.
(a) Relative growth of spheroid after PAM treatment (Texp = 120 s) for several transfer times Ttrans. The spheroids were cultured during five days in DMEM and transferred in PAM at day 0. Data are shown as means ± SD from four independent experiments. (b) Genotoxic effect of PAM detected 4 h after transfer time of MCTS in PAM. Immuno-detection of the phosphorylation of the histone variant H2AX (phospho-H2AX, green) on 5 μm cryosections of control spheroids or treated spheroids. DAPI (blue) correspond to the Nuclei. Data shown are representative images from four independent experiments. Scale bar, 100 μm.

