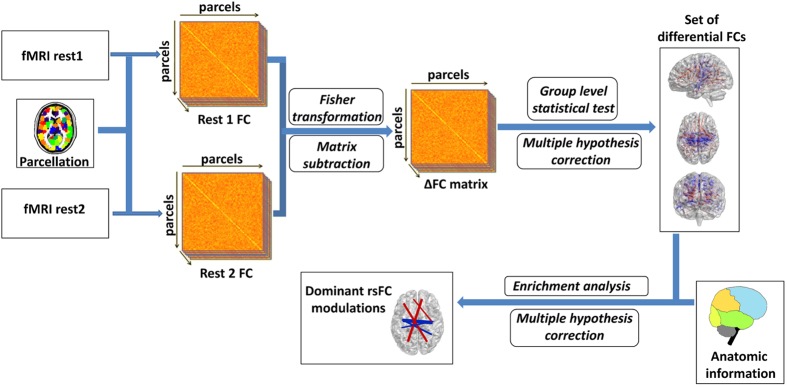
Figure 5. An illustration of the rsFC analysis steps.
Following parcellation, cross-correlation matrices were calculated for each subject and resting-state session. A paired t-test was applied on the Fisher-transformed rsFC values to identify parcel-pairs for which rsFC changed significantly. An FDR procedure was used to correct for multiple testing. Next, anatomy-based enrichment analysis was used to characterize the identified changes in rsFC.

