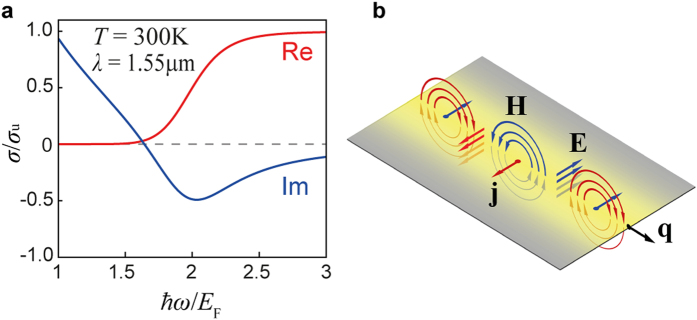
Figure 1. Spectral transition of graphene and the TE mode.
(a) Graphene sheet conductivity (red – real, blue – imaginary part) in the spectral transition region, obtained using the RPA at indicated parameters. (b) Schematic representation of graphene TE mode with wavevector q as an oscillation of surface current j under excitation by transverse electric field E.

