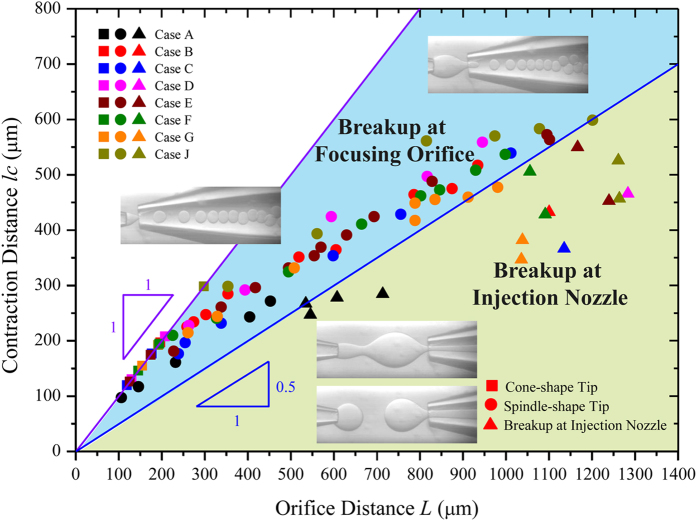
Figure 3. Phase diagram showing flow behaviors influenced by channel dimension.
 represents cone-shape tip, while the region of
  indicates the spindle-shape tip.
  marks the transition of droplet breakup location from focusing orifice to injection nozzle. Different symbol colors represent different cases (Table 1). Different symbol shapes distinguish flow behaviors, where square denotes cone-shape tip, circle is for spindle-shape tip, and triangle means breakup at injection nozzle. The phase diagram is obtained with
  and
and  . Insets: snapshots of cone-shape tip, spindle-shape tip and breakup at focusing orifice and injection nozzle, respectively.

