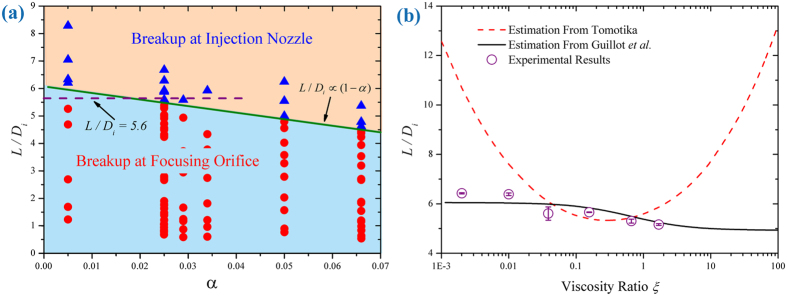
Figure 4. Condition for the transition of droplet breakup location.
(a) Critical  for breakup at injection nozzle as a function of
  . Solid line represents the condition of
  from Eq. (4) where
  , while dashed line denotes
  as an estimate under the assumption of
  with
with  . For the same α, several values of Df are tested (see supplementary Fig. S2). Triangle represents breakup at injection nozzle, while circle denotes breakup at focusing orifice. Data are obtained with viscosity ratio
  . (b) Plot of
  as a function of viscosity ratio
  . The black solid curve is obtained from Eq. (7) based on the result of Guillot et al.42, while the red dashed curve is estimated from Tomotika46 (see “determining the most unstable mode of a viscous jet” in supplementary information). Experimental results show better agreement with solid-curve estimation. Since the dashed-curve is taken under the circumstance of unbounded quasi-static flow, while solid-curve considers device confinement and flow rates, the difference in the two estimates reveals the significance of channel confinement and flow rates in affecting confined droplet breakup.

