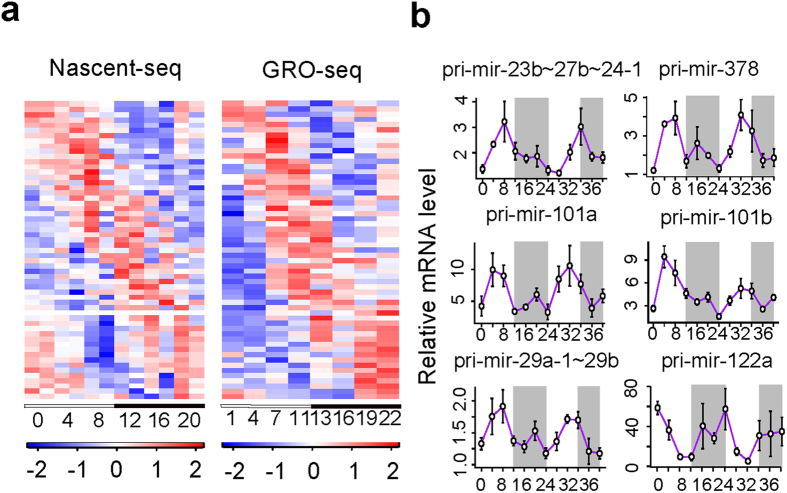
Figure 1. Circadian expression of miRNA primary transcripts.
(a) Two heatmaps showed the expression patterns of circadian miRNA primary transcripts from Nascent-seq and GRO-seq respectively. High (red) and Low (blue) expression values as Z-scored normalized ratios are indicated in the color scale bar at the bottom. Black/white bars indicate the circadian day (white) and night (black) of the consecutive circadian cycles. (b) Expression patterns of circadian miRNA primary transcripts validated by qPCR. The x-axis represents the circadian time (CT), while the y-axis represents the relative expression values normalized by those of Actb. The white regions represent subjective day while the gray regions represent subjective night.

