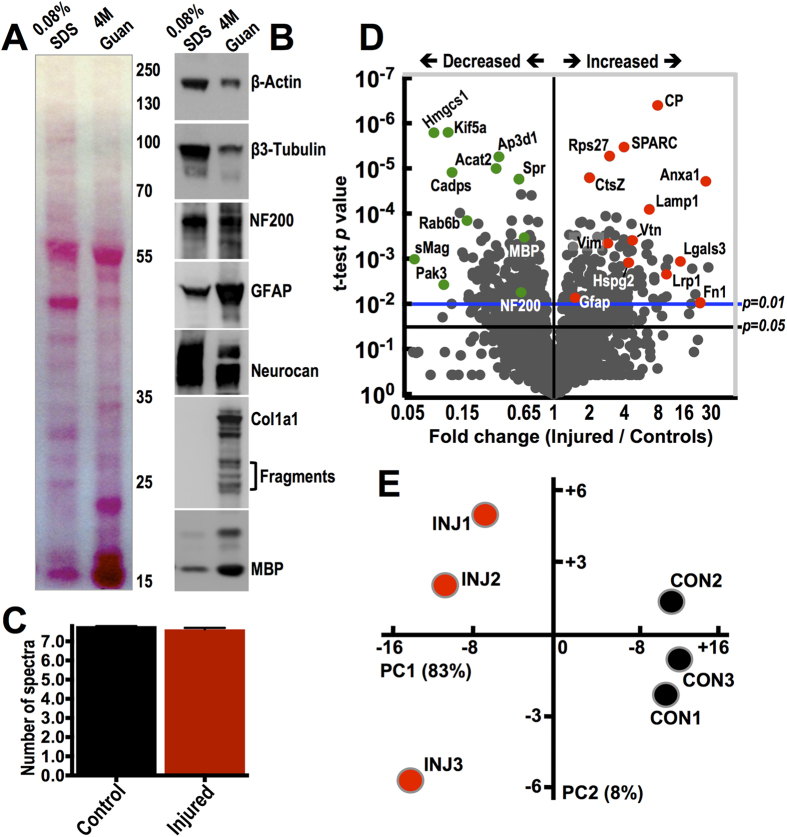
Figure 1. Proteomics analysis of ECM-enriched protein fraction of injured spinal tissue.
(A,B) Protein composition in 0.08% SDS and 4 M guanidine extracts derived from T10 injury epicentre spinal cord explants, 8 weeks post-contusion. Ponceau staining (A) shows a clear difference in the protein content of the 2 extracts. 15 μg of protein was loaded in both lanes. Immunoblotting (B) depicts the relative abundance of selected proteins in SDS and guanidine extracts. (C) Average number of normalized spectral counts measured in 4 M guanidine extracts of 3 uninjured control and 3 injured T10 spinal cord specimens by shot-gun LC-MS/MS with a total of 2346 proteins identified, 10 ppM peptide mass accuracy tolerance, 1% false discovery rate and 95% peptide and protein identification probability. (D) Volcano plot shows differential protein expression measured by spectral counting in 3 uninjured control and 3 injured T10 spinal cord extracts. Proteins are separated according to their spectral count fold-change (Injured/Control; x-axis) and their two-tailed t-test P value (y-axis). P = 0.05 and P = 0.01 are indicated. Selected highly dysregulated proteins are highlighted (upregulated: red; downregulated: green). (E) Principal component analysis (PCA) clustering control and injured T10 spinal cord extracts based on spectral counting of the 2346 LC-MS/MS protein identifications.

