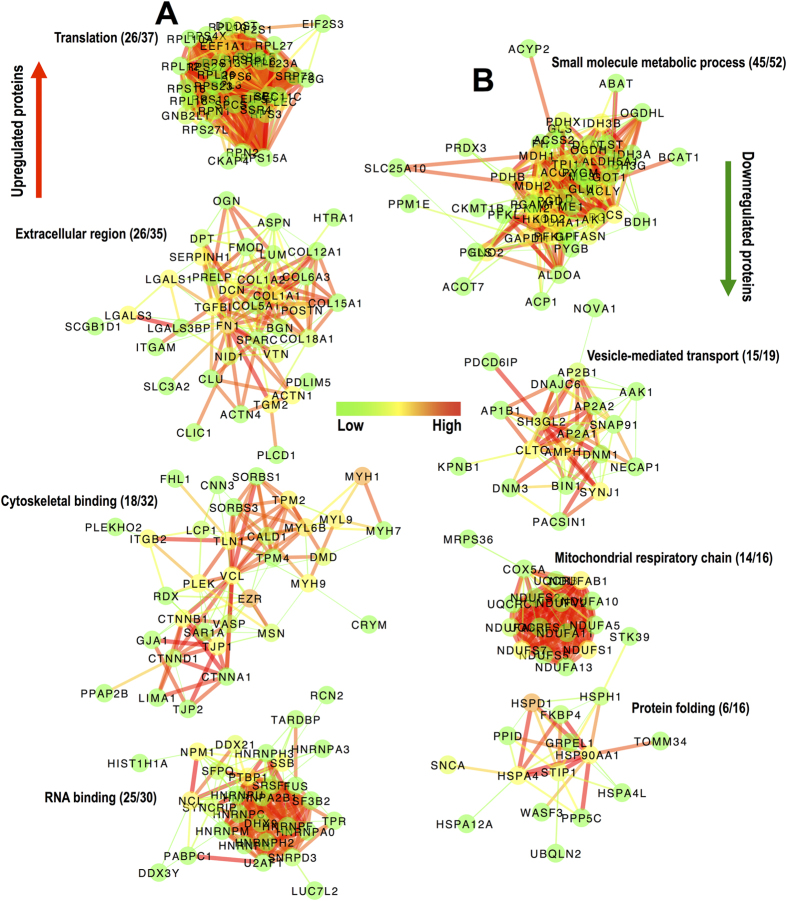
Figure 2. Network analysis of differentially regulated proteins in chronic SCI tissue.
(A,B) The 8 most populated subnetworks generated by MCL clustering (1.9 inflation value & 0.4 edge weight cut-off; StringDB, v9.1) of upregulated (A) and downregulated (B) protein networks shown in Supplementary Figure S1. Individual subnetworks were analysed by BiNGO to identify the predominant gene ontology term. Numbers in parenthesis indicate the number of proteins in the predominant gene ontology versus the total number of proteins in each subnetwork. Node color indicates betweeness centrality while edge color indicates interaction score based on the predicted functional links between nodes (green: low values; red: high values).

