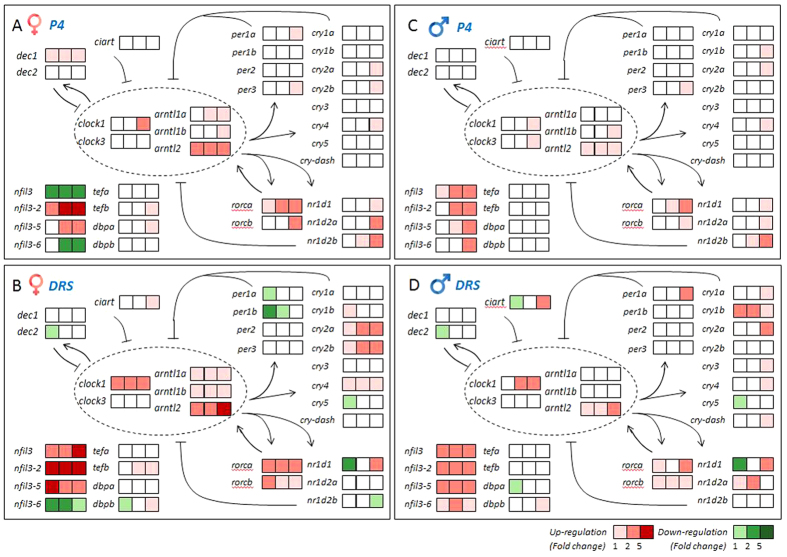
Figure 5. Heat map depicts the whole pattern of transcriptional changes in circadian rhythm network in eyes.
(A,B) Heat map of eyes of females after exposure to different doses of P4 (A) and DRS (B) in a color scheme. (C,D) Heat map of eyes of males after exposure to different doses of P4 (C) and DRS (D) in a color scheme. Gene expressions are expressed as fold-changes compared to unexposed (normal) fish sampled at the same time-point and displayed in colors. Horizontal row of squares represent three doses from low, middle to high (from left to right). The legend listed in the lower right corner of the graph gives the thresholds for different colors. Numbers (1,2,5) mean boundaries between each color, representing fold-changes. Light red: fold changes between 1–2-times; Middle red: fold changes between 2–5-times; Dark red: fold changes higher than 5-times, and similarly for the down-regulation in green colors. Gray represents no significant alterations.

