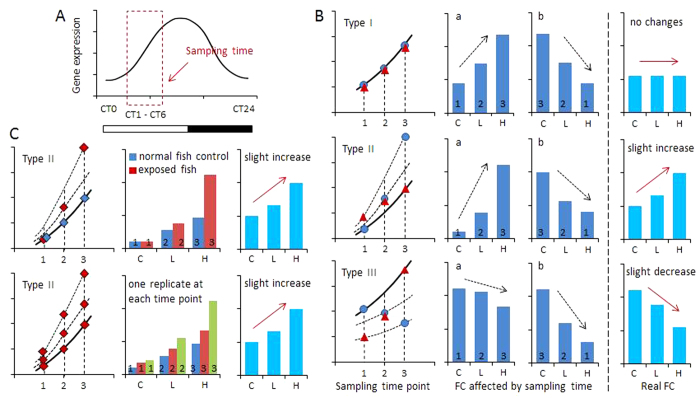
Figure 6. Schematic diagram depicts possible expressional alterations of circadian gene caused by sampling time.
(A) Representative theoretical example of expressional changes of one circadian gene. Transcriptional level increases at day-time and decreases at night. Sampling time is assumed within a few hours after lights on (CT1–CT6). (B) Sampling time affects the interpretation of gene expressions following compound exposure. Three different types (I, II and III) are compared. Type I, no real fold changes (FC); type II, slight increase; type III, slight decrease. Numbers (1, 2 and 3) represent three sampling time points. Three blue dots  represent sampling order with control (C), low dose (L) and high dose (H) of compound (from left to right). Assumed fold-changes are represented in figure a. Three red triangles
  represent reverse sampling order with high dose, low dose and control (from left to right). Assumed fold-changes are represented in figure b. Red solid arrows represent the tendency of assumed real gene expressions; black dashed arrows represent the tendency of gene expressions affected by sampling time. (C) Two approaches help to reduce the effects of sampling time, shown for type II expressional changes as example. Upper row: sampling of exposed fish (both solvent control and compound-exposed) and unexposed (normal) fish at each time point. In this case, pairwise comparison can be conducted for each time point. Lower row: one replicate of each exposed group sampled at the same time point with subsequent assessment of average values.

