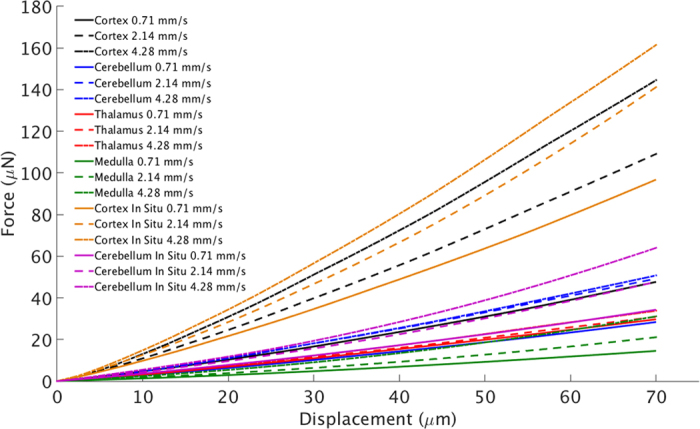
Figure 4. Force-displacement curves of the in vitro cortex, cerebellum, thalamus, and medulla, at 0.71, 2.14, and 4.28 mm/s.

Also shown are the individual force-displacement curves for the in situ cortex and cerebellum for the same velocities. The different responses of the individual regions to mechanical loads are evident from this graph. What is most notable is the significantly larger forces recorded from the in vitro and in situ cerebral cortex at higher velocities compared with the other regions investigated.
