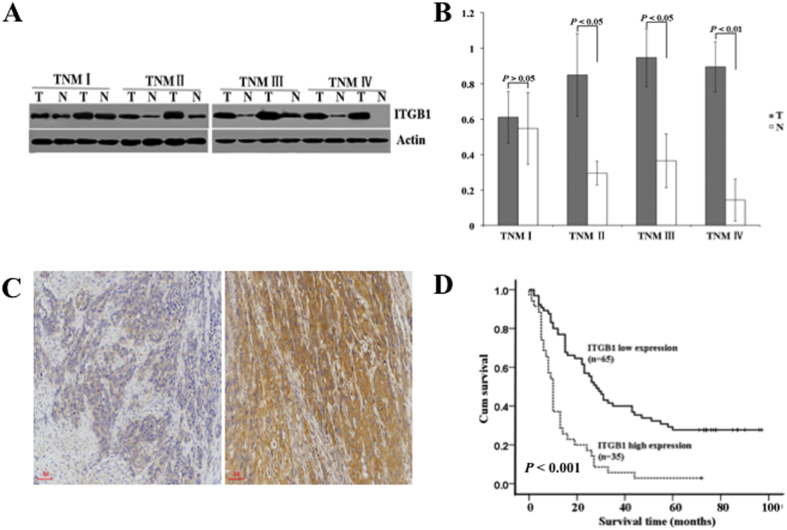
Figure 4. ITGB1 protein expression in ESCC and Kaplan-Meier survival curves of overall survival with regards to ITGB1 expression in ESCC.
(A) Representative Western blots of ITGB1 protein expression level in ESCC and matched N with different TNM stages. (B) Quantification of ITGB1 protein expression in TNM I–IV ESCC and corresponding N. (C) Representative negative and positive immunoreactivity of ITGB1 in poorly-differentiated ESCC, respectively. (D) The 5-year overall survival curves of ESCC patients with low (n = 65) and high ITGB1 (n = 35) protein expression (P < 0.001).

