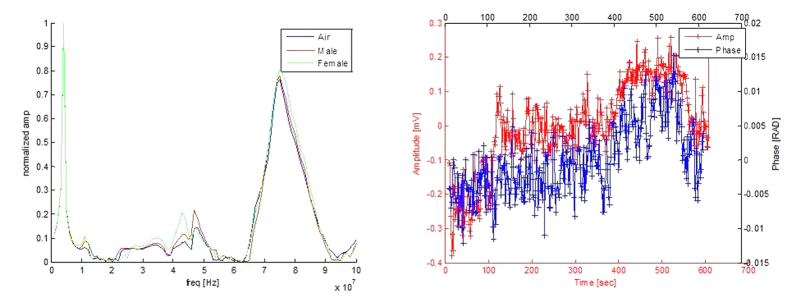
Figure 2. Characterization of the experimental system.
Left panel shows transfer functions across the coil as a function of frequency. The panel displays three curves, from two volunteers wearing the coils and a measurement in air. The resonance frequencies are evident. (The max amplitude of the 3 measurements was normalized to 1). Right panel shows the system measurement across the coils in air as a function of time.

