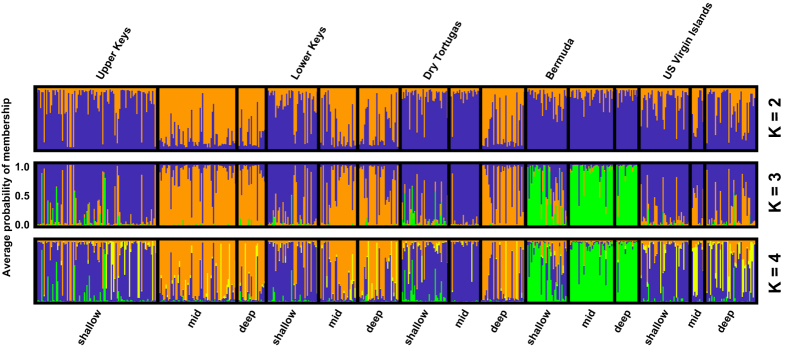
Figure 1. Porites astreoides population structure across regions [Upper Keys, Lower Keys and Dry Tortugas (within Florida), Bermuda and the U.S. Virgin Islands] and depths [shallow (≤10 m), mid (15–20 m) and deep (≥25 m)].
Bar graphs show the average probability of membership (y-axis) of individuals (N = 590, x-axis) in K = 2 to K = 4 clusters (shown in ascending order) as identified by STRUCTURE. Samples were arranged in order of increasing depth within region.

