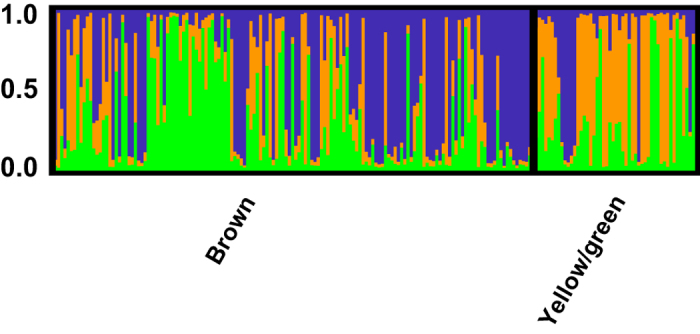
Figure 5. Porites astreoides population structure by color morph (yellow/green or brown).

Bar graphs show the average probability of membership (y-axis) of individuals (N = 200, x-axis) in K = 3 clusters as identified by STRUCTURE.

Bar graphs show the average probability of membership (y-axis) of individuals (N = 200, x-axis) in K = 3 clusters as identified by STRUCTURE.