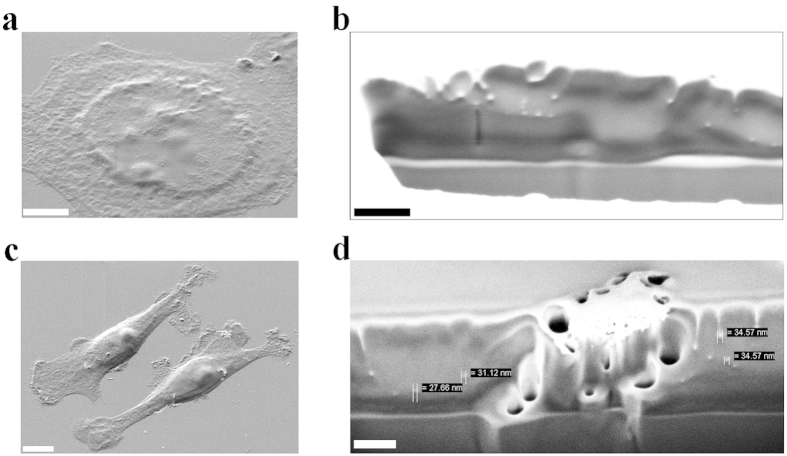
Figure 4. MNPs internalization investigated by the FIB-SEM technique.
(a) a SEM image of a MCF7 cell before undergoing the precise milling process by the FIB gun. Scale bar: 5 μm. (b) a cytoplasm portion of the MCF7 cell depicted in (a), after the milling procedure and the zooming in, where several white and rounded objects are visible. In this picture a high brightness/contrast ratio was set to better appreciate the separation line between cytoplasm (grey) and external membrane (white). The white particles in these images have a range diameter of 20–40 nm, in agreement with the MNPs diameter expectations. The bottom part, in grey, is the glass surface where the cells grew. Scale bar: 200 nm. (c) a SEM image of two MDA-MB-231 cells before undergo the precise milling process. Scale bar: 5 μm. (d) the cell in (c), after the FIB-guided milling process, displays a MNPs aggregate and several single particles inside the cytoplasm. The bottom part is, as before, the glass surface. Scale bar: 200 nm.

