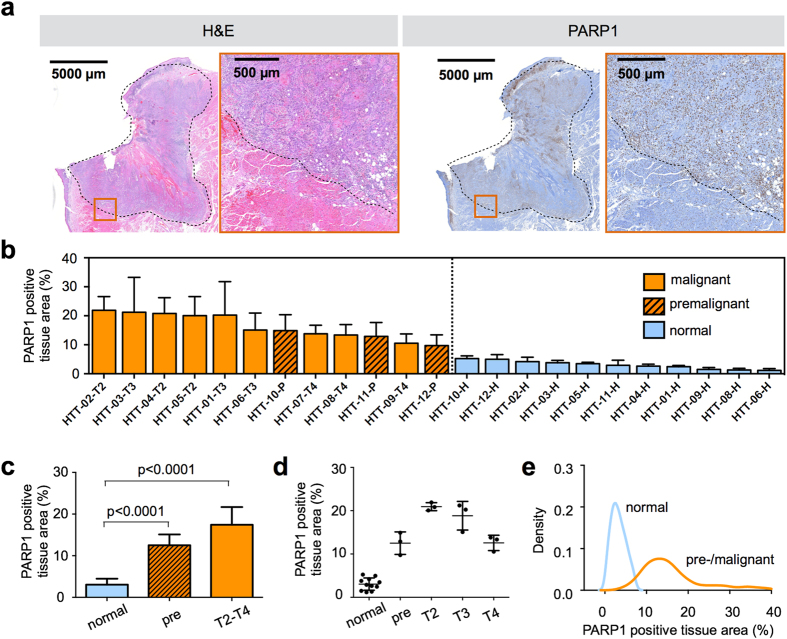
Figure 1. PARP1 expression in human tongue tumors.
(a) Surgically removed human squamous cell carcinoma specimens of the tongue were stained for PARP1 using an anti-PARP antibody and immunohistochemical detection. Adjacent sections were stained with H&E for pathological evaluation and staging of the malignancy of the tissue. The dotted line marks the tumor margin in the displayed T2 staged tumor. The red squares indicate enlarged regions in adjacent images. The image shown is a representative example selected from n = 12 samples. (b) PARP1 quantification in human tongue tumor tissue in a waterfall plot of the PARP1-positive tissue area. The PARP1-positive tissue is represented by brown (PARP1) and the total tissue areas by blue staining. In each sample, 5–10 fields of view in the tumor area or adjacent healthy tissue were analyzed. Displayed are means ± SD. HTT = human tongue tumor; color code: orange = malignant tissue (squamous cell carcinoma T2-T4), dashed orange = premalignant cases (moderate to severe dysplasia, carcinoma in situ), blue = corresponding normal adjacent tongue tissue. (c) PARP1-positive tissue area, grouped for normal tissue, premalignant, and malignant (T2-T4 tumor stages) cases. Statistical significance was determined using an analysis of variance where multiple comparisons were controlled using the Holm-Šidák at the familywise error rate of 5%. (d) Individual values for PARP1-positive tissue area, grouped for the pathologically assessed tumor stage (premalignant, T2, T3, T4) and compared to normal adjacent tissue. (e) Density plot of all PARP1-positive tissue area values from each field of view, pooled in two groups (normal and premalignant/malignant). See Supplementary Fig. S2 for additional statistical parameters.

