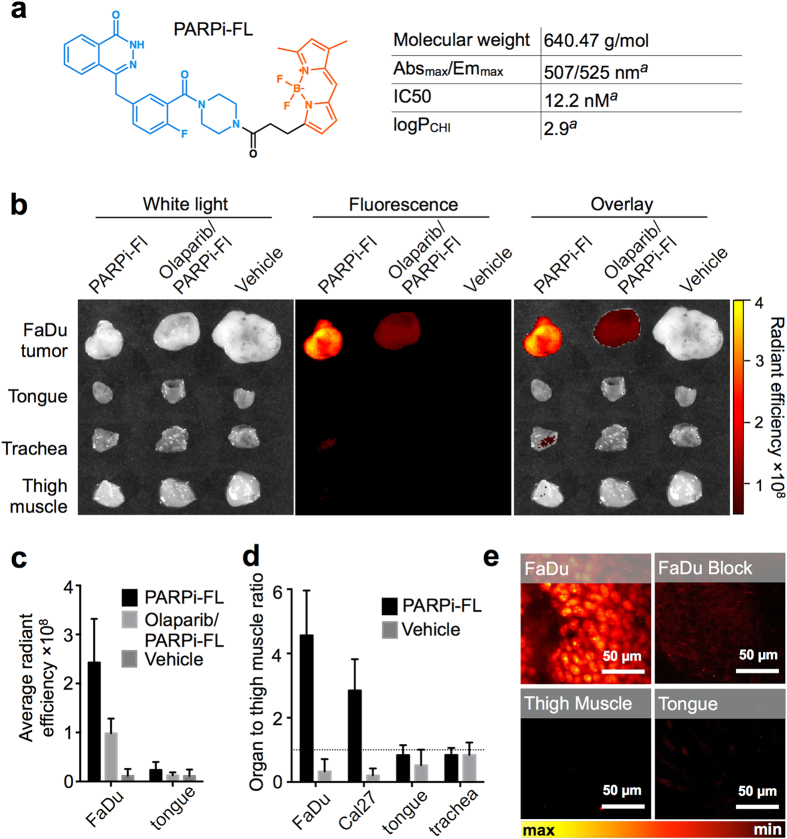
Figure 3. PARPi-FL accumulation in OSCC xenografts in mice.
(a) Molecular structure25,48 and physicochemical properties of PARPi-FL (blue = DNA binding domain; orange = BODIPY® FL fluorescence dye moiety); aIrwin et al. 201443. (b) Representative epifluorescence images of FaDu tumor, tongue, muscle, and trachea. Radiant efficiency displayed in units of [(photons/s/cm2/sr)/(μW/cm2)]. (c) Average radiant efficiency of FaDu tumors and tongue. (d) Tumor/organ-to-muscle ratios from images of FaDu and Cal27 tumors, tongue, and trachea calculated as the average radiant efficiency in a region of interest. (c,d) display means and SD from n ≥ 5 tissue specimens for PARPi-FL, Olaparib/PARPi-FL, and n ≥ 3 for vehicle control. Images and semiquantitative analyses of fluorescence intensities were acquired ex vivo 90 minutes post-injection of PARPi-FL (75 nmol/167 μl PBS with 30% PEG300), Block (Olaparib; 3750 nmol/100 μl PBS with 30% PEG300 30 minutes prior to PARPi-FL), or vehicle (167 μl PBS with 30% PEG300). (e) Confocal images of PARPi-FL signal in freshly excised tumor, tongue, and trachea at 90 minutes post-injection of PARPi-FL or Block (as described in (a)).

