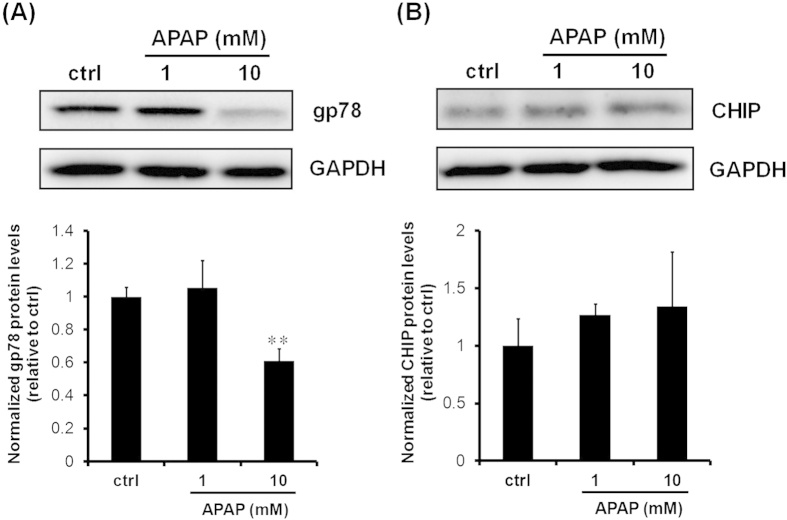
Figure 6. Effects of APAP on gp78 and CHIP protein levels.
Rat hepatocyte spheroids (day 5) were exposed to APAP (1 and 10 mM) for 24 h before harvesting. (A) Representative results of gp78 and GAPDH immunoblotting analyses of cell lysates (10 μg of protein) are shown in the top panel. GAPDH was measured as a loading control. Cropped blots were shown and the full-length blots were presented in Supplementary Fig. 1. The results of densitometric quantification of gp78 protein levels are shown in the bottom panel. Results are expressed as means ± S.D. (n = 3 independent experiments, **P < 0.01 vs. ctrl, Tukey’s test). (B) Representative results of CHIP and GAPDH immunoblotting analyses of cell lysates (10 μg of protein) are shown in the top panel. Cropped blots were shown and the full-length blots were presented in Supplementary Fig. 1. The results of densitometric quantification of CHIP protein levels are shown in the bottom panel. Results are expressed as means ± S.D. (n = 3 independent experiments).

