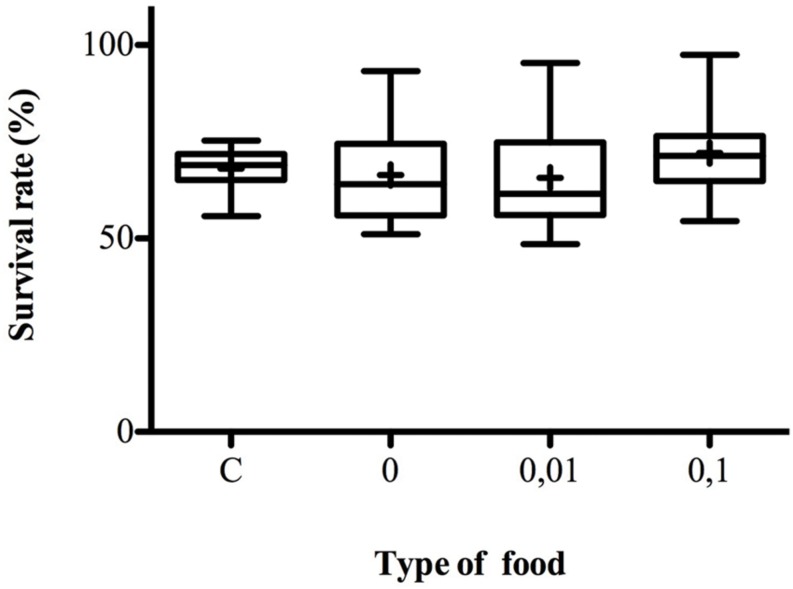
FIGURE 5.
Survival rate on control and menthol-enriched food. The box-and-whisker plots show the survival rates on different types of food, C, control food, 0%, no menthol plain-Food, 0.01, 0.01% menthol-enriched food, 0.1, 0.1% menthol-enriched food. Females were given the choice to lay eggs on four different oviposition sites with increased menthol concentration ranging from 0 to 0.5%. For each site larvae were raised at 25°C until complete development. For Control-line survival rate is measured in a multiple choice assay with four sites filled with control food and flies from parental lines never exposed to menthol. Adults were counted at emergence and survival rate was measured. N = 10–16. For more information, refer to Figure 1.

