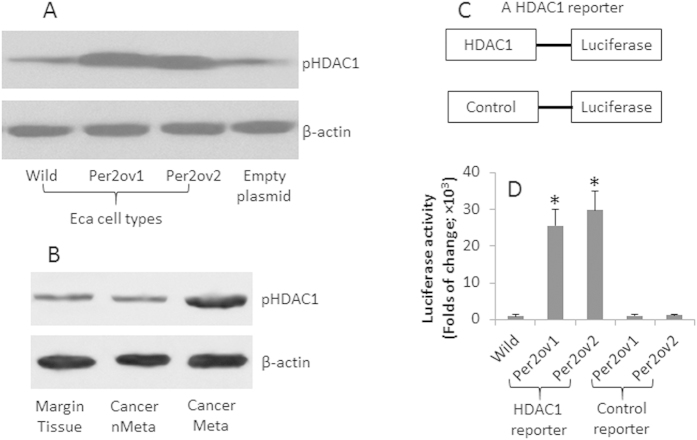
Figure 3. Per2 increases HDAC1 in esophageal cancer cells.
Eca109 and CP-C cells were overexpressed with Per2; the cell extracts were analyzed by Western blotting to assess the levels of pHDAC1. (A) the Western blots indicate the levels of pHDAC1. (B) the immune blots indicate the levels of pHDAC1 in the samples of human esophageal cancer. (C) the sketch show constructs of a HDAC1 reporter and a control reporter. D, the Per2-overexpressing Eca cells were transfected with the HDAC1 reporters and analyzed by luciferase activity assay. The bars indicate the luciferase activity (mean ± SD; *p < 0.01, compared with the wild group). The data are representative of 3 independent experiments. (The full length gel graphs are presented in the relevant information).

