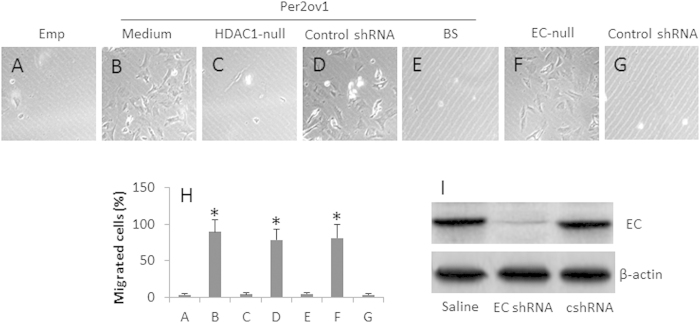
Figure 5. Per2 promotes Eca cell migration.
Eca109 cells with Per2 overexpression (Per2ov1), or transfected with empty plasmids (Emp) were cultured in Transwells. (A–G) the representative images (×200) show the migrated cells. (H) the bars indicate the summarized total migrated cells in (A–G) (mean ± SD; *p < 0.01, compared the group transfected with empty plasmids). (I) the Western blots show the EC gene knockdown results. The data are representative of 3 independent experiments. (The full length gel graphs are presented in the relevant information).

