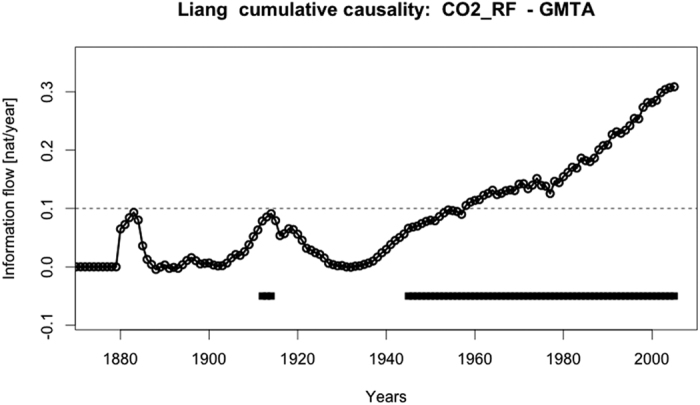
Figure 1. Global information flow from radiative CO2 forcing to GMTA.

Shown is the time dependence of the information flow between CO2 forcing and GMTA when calculating segments with increasing lengths beginning from 1850 to the actual displayed year. Statistically significant values are indicated by the dark squares in the lower part of the figure and the dashed horizontal line at 0.1 [nat/ut] indicates the threshold for relevant flows.
