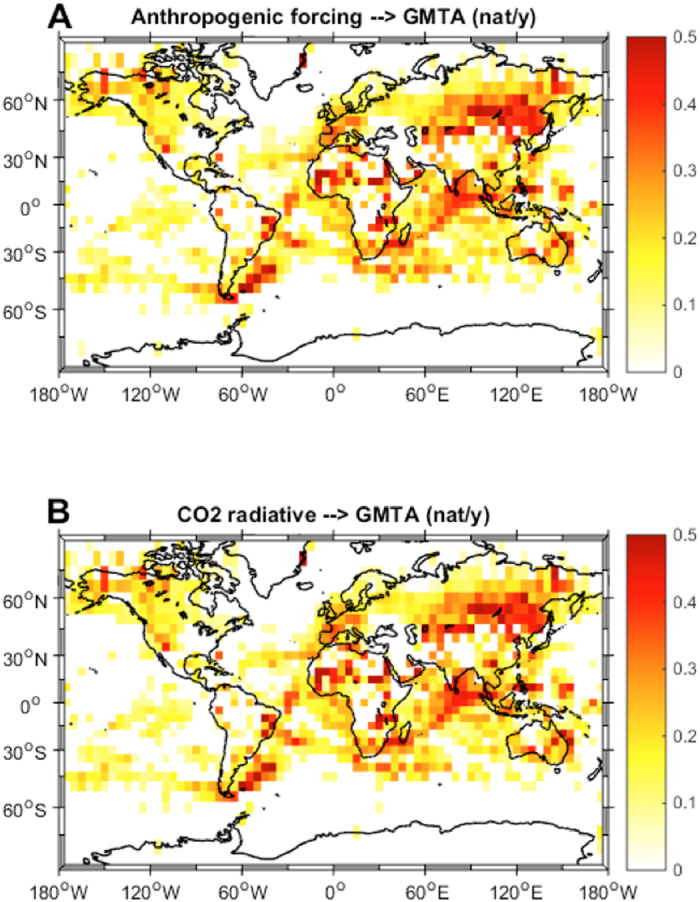
Figure 3. Global information flow from anthropogenic forcing to GMTA.

Shown is the spatial distribution of the information flow between the total anthropogenic forcing and the gridded global mean temperature anomalies (GMTA) (A) and the spatial distribution of the information flow between the radiative forcing caused by CO2 and the gridded global mean temperature anomalies (GMTA) (B). The maps were created by the authors using the m-map toolbox included in Matlab®.
