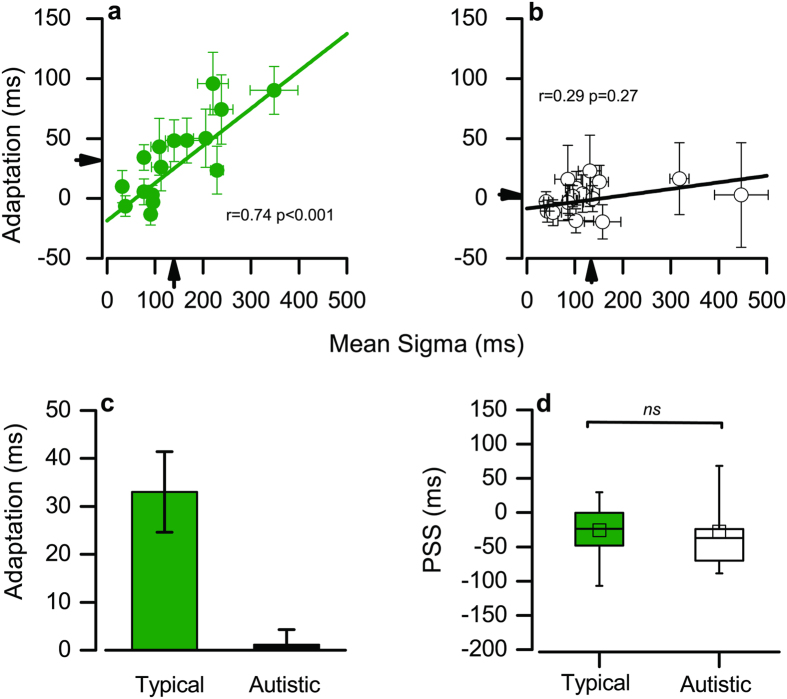
Figure 2. Adaptation effect, point of perceived simultaneity and simultaneity bandwidths.
(a,b) The adaptation effect (the difference in PSS for trials preceded by audio-lead and those by audio-lag) as a function of the simultaneity bandwidth (standard deviation of Gaussian fitted to all data), for typical (a) autistic (b) adults. Data were bootstrapped to estimate standard errors, indicated by the bars. (c) Mean adaptation effect for the two groups. (d) PSSs for each group, given by the mean of the Gaussian functions fitted to all data of each participant. The box refers to the 25 and 75 percentiles, the whiskers to 5 and 95 percentiles.

