
Figure 4. Relationship between adaptation and Social Responsiveness Scale.
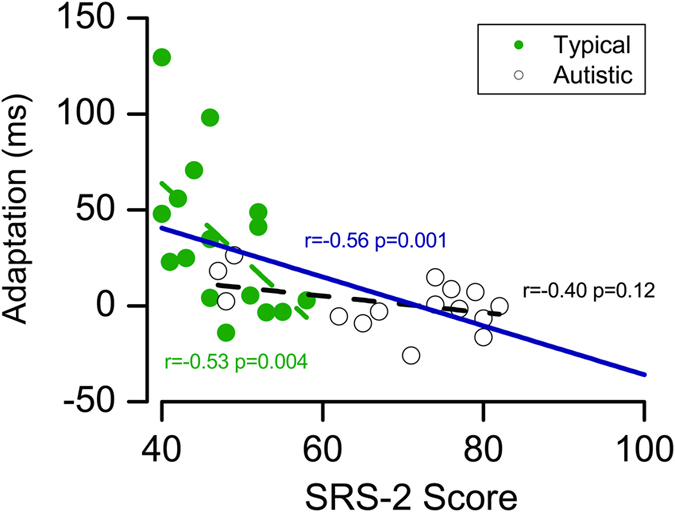
Adaptation effect (the difference in PSS for trials preceded by audio-lead and those by audio-lag) as a function of Social Responsiveness Scale (SRS-2) score for all individuals (typical: green; autistic: black). The colour-coded broken lines show the correlations within each group, the continuous navy line the correlation between all participants. Full (blue dashed line) and partial correlation between recalibration effect and autistic traits measured by SRS-2 in the typical (green dashed line) and autistic (black dashed line) group.