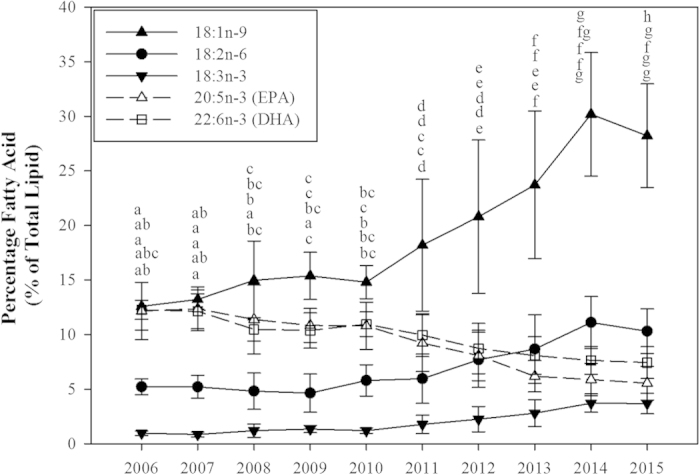
Figure 1. Changes in the levels of fatty acids (% of total fatty acids), of either marine (- - -) or terrestrial origin (___), in the flesh of Scottish Atlantic salmon farmed between 2006–2015 (mean ± SD).

Stacked lettering above data points are in the order of 18:1n-9, EPA, DHA, 18:2n-6 and 18:3n-3 respectively, and indicate significant differences (P < 0.05) between years for the same fatty acid (n = 106, 174, 247, 81, 85, 393, 212, 523, 546 and 687 for 2006–2015 respectively).
