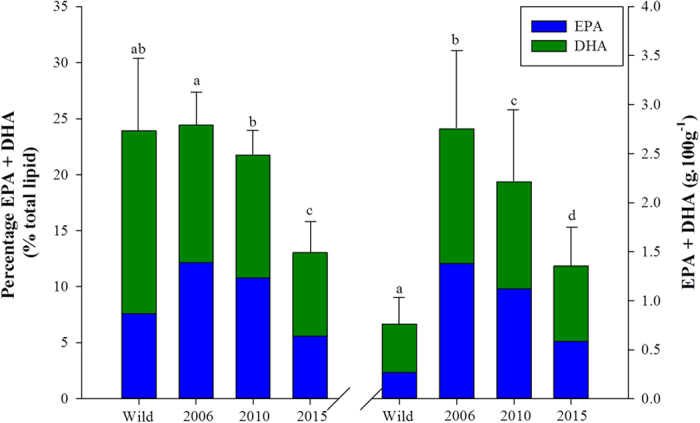
Figure 4. Differences in the proportions (% of total fatty acids) and absolute levels (g.100 g−1) of EPA + DHA fatty acids between wild (Pacific species) and farmed Scottish Atlantic salmon from 2006, 2010 and 2014 (mean ± SD).

Bars bearing different lettering indicate significant differences (P < 0.05) (n = 21 for wild salmon and 106, 85 and 687 for Scottish Atlantic salmon farmed in 2006, 2010 and 2015 respectively). Stacked bars represent contribution of EPA and DHA to total values for comparative purposes.
