
Figure 3. Distribution of modified Rankin scale scores at 90 days by serum ferritin levels categorized in quartiles.
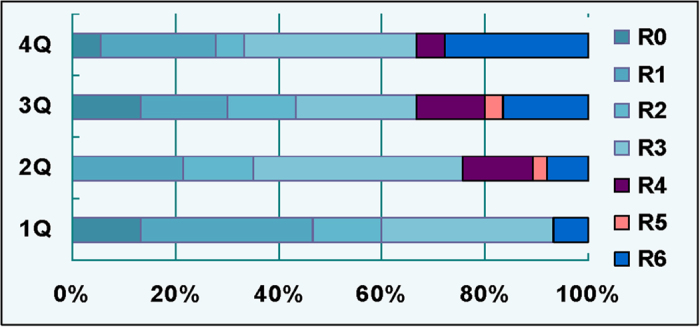
Ferritin levels for the first quartile (1Q), 0–80 ng/mL; second quartile (2Q), 81–160 ng/mL; third quartile (3Q), 161–275 ng/mL; fourth quartile (4Q), >276 + ng/ml. Data were presented as Mean ± SD. *P < 0.05 vs. Control; @P < 0.05 vs. PO.