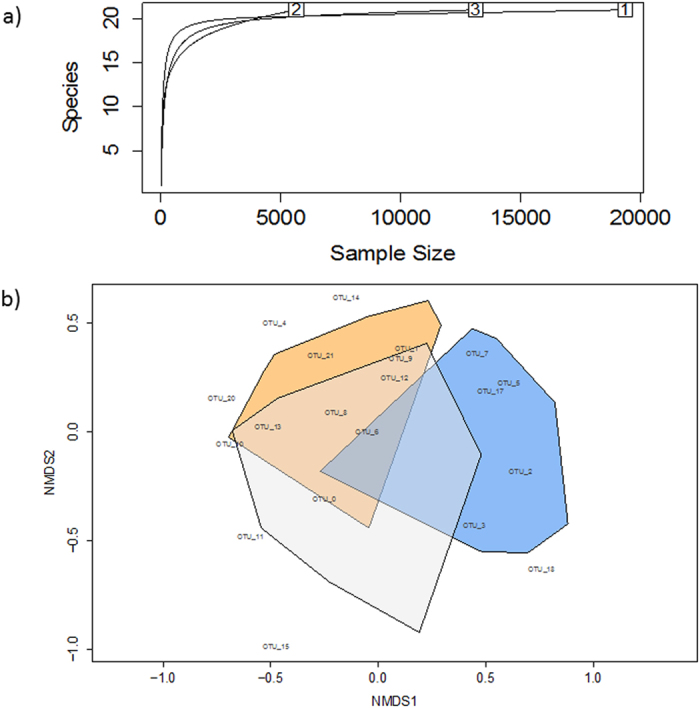
Figure 2.

(a) Species rarefaction curve and (b) nonmetric multidimensional scaling (NMDS) ordination of the top 20 fungal OTUs on F. mandshurica at three locations. In (a), each boxed number refers to the location of each tree. In (b), each convex hull connects the vertices of the points made by each sample from each of the three locations. Orange, blue and grey colors represent individual sites/trees 1, 2, and 3, respectively. The first two dimensions are presented. The final stress value for the NMDS ordination was 0.15.
