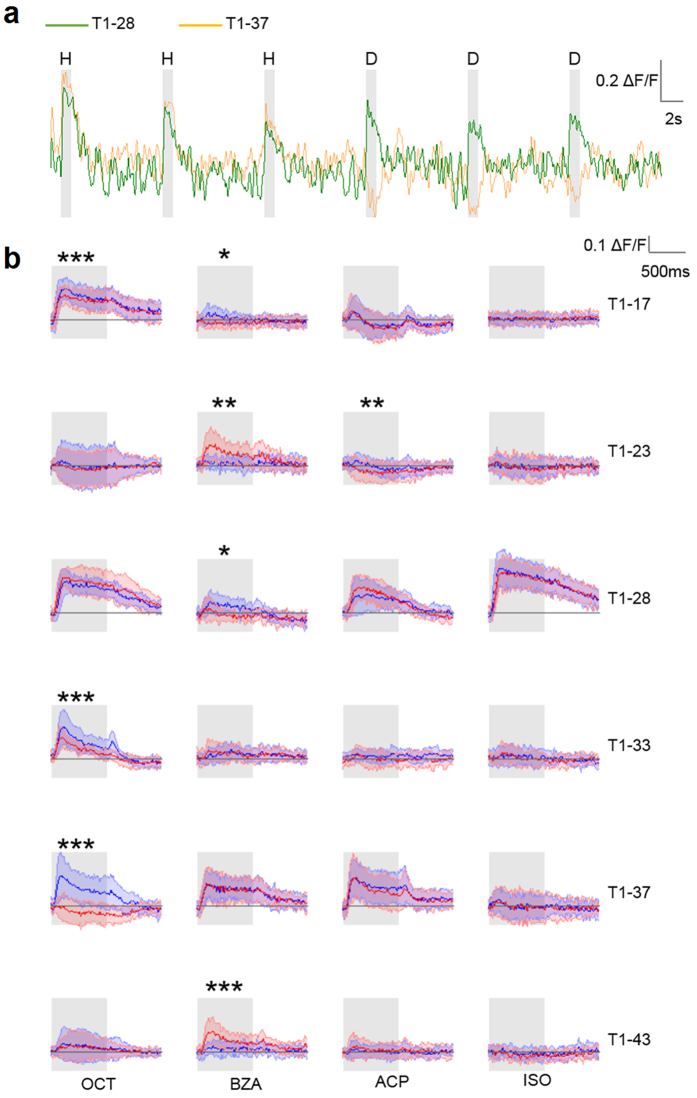
Figure 1. Induced glomerular responses.
(a) Activity profiles of glomerulus T1-37 and T1-28 measured in one individual during 3 presentations of OCT-h (H) followed by 3 presentations of OCT-d17 (D). (b) Mean odorant response profiles ± s.d. of 6 exemplificative glomeruli (rows) to four odorants (columns). Response profiles to the common isoforms are plot in blue, to the deuterated isoforms in red; grey shadows indicate stimulus delivery. Significant differences are indicated (paired-sample t-test, *p < 0.05, **p < 0.01, ***p < 0.005; N = 11 for BZA and ISO, N = 12 for ACP and OCT). Odorant abbreviations are 1-octanol: OCT; benzaldehyde: BZA; acetophenone: ACP; isoamyl acetate: ISO.

