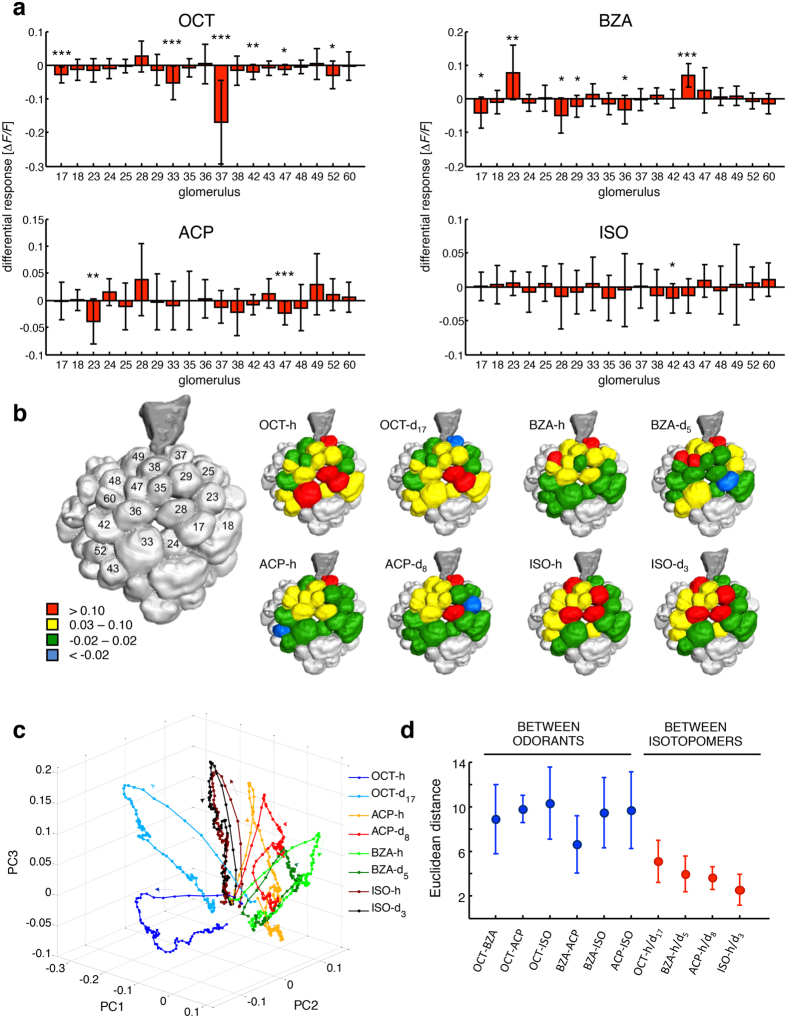
Figure 2. Odorant response maps.
(a) For each subject, the difference between the responses to H- and D-isotopomer was calculated and mean differences across subjects ± s.d. are plotted. Significant differences are highlighted (paired-sample t-test, *p < 0.05, **p < 0.01, ***p < 0.005; N = 11 for BZA and ISO, N = 12 for ACP and OCT). (b) Graphical representation of odorant-induced response maps. Glomerular responses were classified in 4 groups: red, high activation: −ΔF/F > 0.10; yellow, low activation: 0.03 ≤ −ΔF/F ≤ 0.10; green, no activity: −0.02 ≤ −ΔF/F ≤ 0.02; blue, inhibition: −ΔF/F < −0.02; glomeruli in grey were not considered in the analysis. (c) PCA of AL response dynamics elicited by the odorants during 1 s stimulus exposure and 1 s post-stimulus phase. Arrows indicate the temporal order of signal build-up and decay. (d) Mean Euclidean distances ± s.d. between different pairs of odorants ( ) and within pairs of isotopomers (
 ). Odorant abbreviations are 1-octanol, OCT; benzaldehyde, BZA; acetophenone, ACP; isoamyl acetate, ISO.

