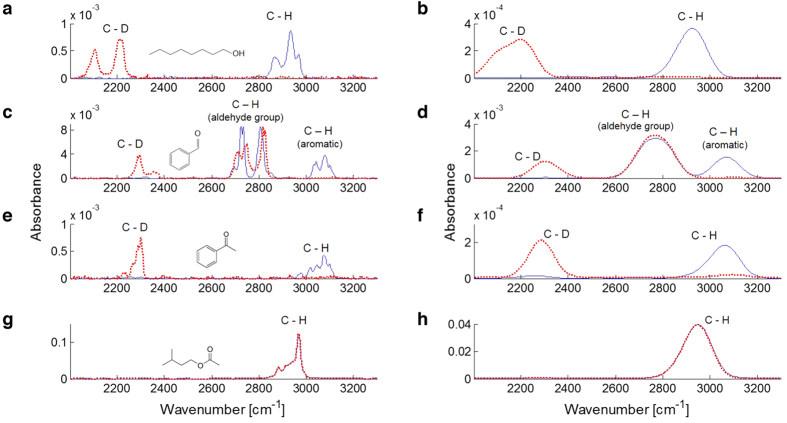
Figure 3. Vibrational spectra comparison.
OCT (a,b), BZA (c,d), ACP (e,f), and ISO (g,h) spectra within the 2000–3300 cm−1 region unfiltered (left column), and broadened (right column). Spectra show absolute absorbance after air baseline subtraction. The different orders of magnitude are due to the different volatility of the compounds. Common ( ) and deuterated (
 ) isotopomers’ profiles are presented. Skeletal formulas of common odorants are shown. Odorant abbreviations are 1-octanol: OCT; benzaldehyde: BZA; acetophenone: ACP; isoamyl acetate: ISO.

