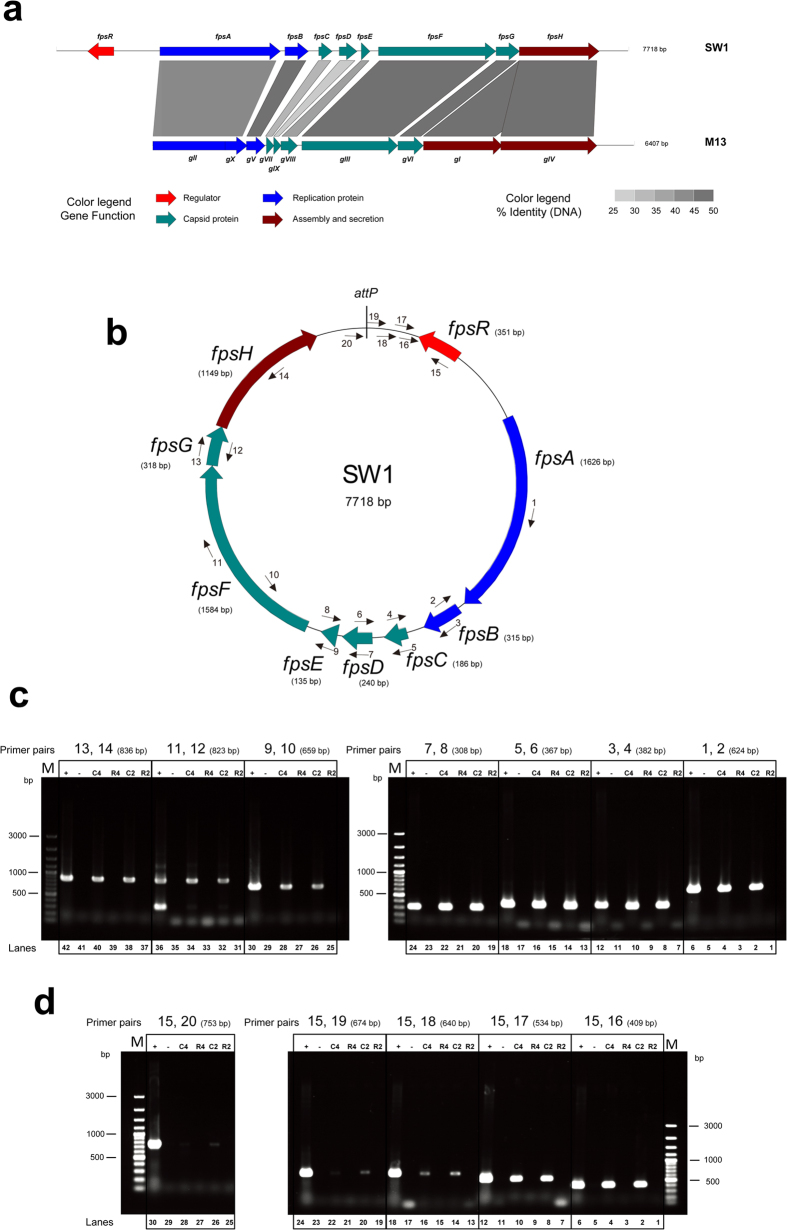
Figure 1. Characterization of the operon structure of SW1.
(a) Comparative genome analysis of SW1 and M13. The scale at the top of the genome is in base pairs. Each arrow represents an ORF, with the colour representing the function of the encoded protein that is indicated in the legend. Percent identities (nucleic acids) between adjacent genomes are coloured as outlined on the bottom of the figure. (b) The genome map of SW1 and the primer pairs spanning across adjacent SW1 genes were used to determine whether the two genes were co-transcribed. (c) Identification of the co-transcription of SW1 genes using RT-PCR. (d) Identification of the 3′UTR downstream of fpsR. The 3′UTR downstream of fpsR was confirmed by PCR using 5 primer sets at different positions. The different templates used for each co-transcription confirmation are presented as: +, WP3 genomic DNA (positive control); -, ddwater (negative control); C4, cDNA of 4 °C; R4, RNA of 4 °C; C2, cDNA of 20 °C; R2, RNA of 20 °C. The primer pairs used in each assay are indicated as numbers: fpsA-B For/Rev (1, 2); fpsB-C For/Rev (3, 4); fpsC-D For/Rev (5, 6); fpsD-E For/Rev (7, 8); fpsE-F For/Rev (9, 10); fpsF-G For/Rev (11, 12); fpsG-H For/Rev (13, 14); fpsRD1 For/Rev (15, 16); fpsRD2 For/Rev (15, 17); fpsRD3 For/Rev (15, 18); fpsRD4 For/Rev (15, 19); fpsRD5 For/Rev (15, 20). The resulting amplicons were analyzed by electrophoresis through 1.0% agarose gels with Gel-Red staining.

