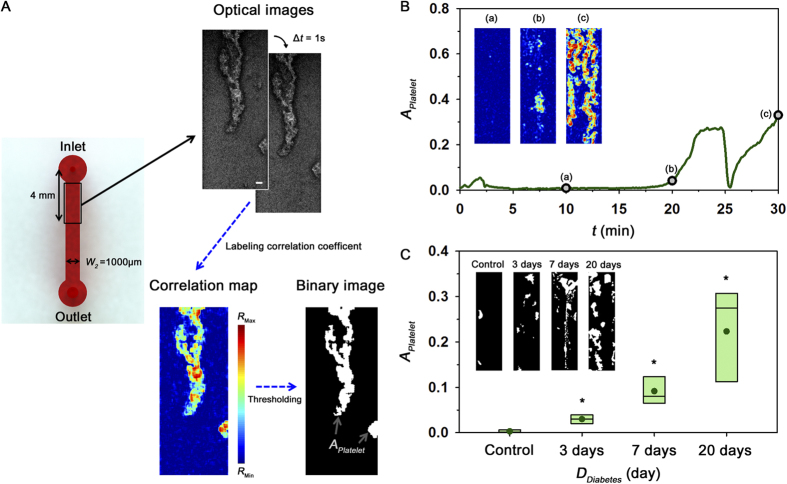
Figure 5. Quantification of platelet adhesion under ex vivo condition.
(A) Procedure for measurement of platelet aggregation in the straight channel. Optical images were obtained by high-speed camera with time intervals (∆t) of 1 s. Scale bar indicates 100 μm. To distinguish adhered platelets from the flowing blood, a correlation map depicting the correlation coefficient of two consecutive images is obtained. By conducting additional image processing techniques, the area of adhered platelets (APlatelet) is obtained. (B) Temporal variation of APlatelet for a rat model with 30 days diabetic duration. Correlation maps at 10, 20, 30 min are inserted. (C) Variation of APlatelet according to the duration of diabetes DDiabetes. Typical binary images for the four groups are included. (*p < 0.005: significant difference from the control group).

