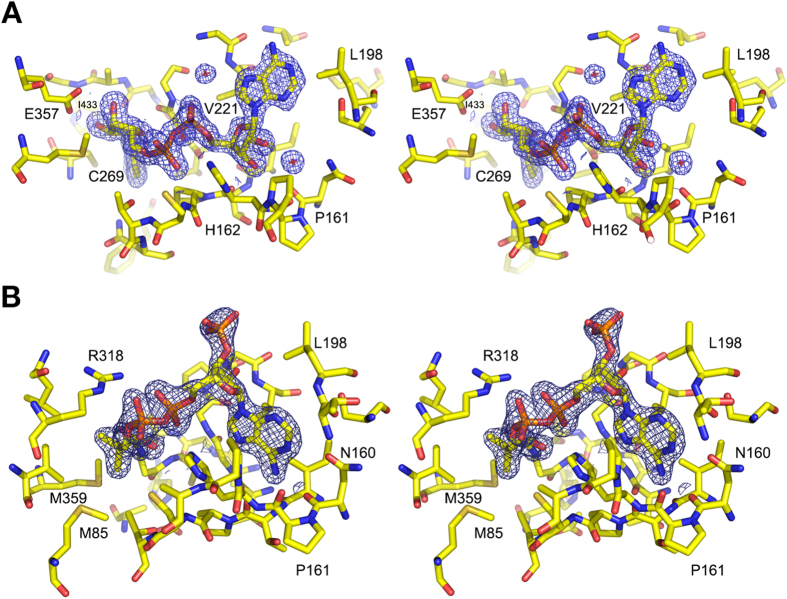
Figure 4. Electron density maps of bound NAD+ and CoA cofactors.
(A) Structure of NAD+ soaked Cphy117820–462. NAD+ and protein residues within 4 Å shown as stick representations and 2mFo-DFc map shown as a blue mesh contoured at 1σ. (B) Structure of CoA soaked Cphy117820–462(C269A) displayed as in (A).

