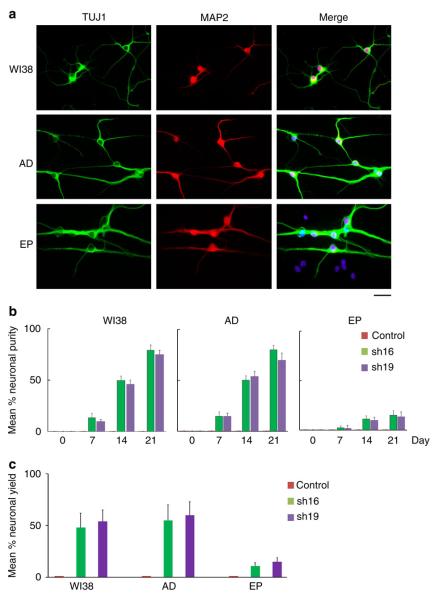
Figure 2. iN cells from WI38, adult dermal fibroblasts (AD) and epithelia cells (EP) with expression of shp16.
(a) shp16 iN cells 3 weeks after induction were positive stainings of MAP2 and TUJ1. Scale bar, 10 μm. (b and c) Quantitative analysis of iN cells from WI38, AD fibroblasts and EP cells with expression of sh16, sh19 or control empty vector. Kinetic analysis of iN purity was counted by TUJ1- and MAP2-positive staining (b). iN yield was determined at 3 weeks after induction (c). Quantitative method of iN purity and yield is the same as that in Fig. 1. Quantitative data were mean±s.e.m. from three biologically independent experiments.

