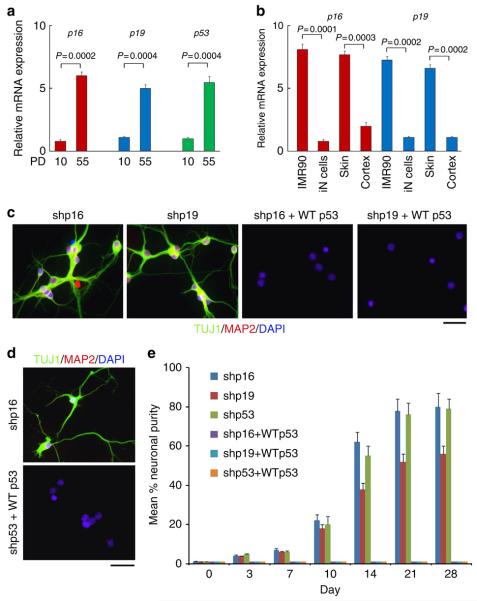
Figure 5. Overcoming senescence induces iN conversion.
(a) mRNA level of p16, p19 and p53 in young and old IMR90 cells. mRNA expression levels of indicated genes were determined by quantitative reverse trancriptase–PCR in population doublings, PD10 and PD55 IMR90 cells. (b) mRNA expression of p16 and p19 in different human cells and tissues (n = 3) detected by quantitative reverse trancriptase-PCR. iN cells were from IMR90 cells expressing miRNA9-124 + Ascl1/Myt1l/Neurod2. (c and d) Wild-type p53 blocks conversion of IMR90 cells into iN cells induced by shp16, shp19 or shp53. Lentiviral wild-type p53 was expressed in IMR90 cells with expression of shp16, shp19 or shp53 (3′ UTR region). The images show the morphology of iN cells 4 weeks after induction. (e) Quantitative data represent mean % iN purity from shp16, shp19 and shp53 plus wild-type p53, respectively. After induction at the indicated time points, iN cells were identified by morphology, TUJ1 and MAP2-positive staining (see method in Fig.1). Scale bar, 10 μm. (a, b and e) Quantitative data are mean ±s.e.m. from three independent experiments. The P-values are based on Student’s t-test.

