
Figure 7. Global gene expression profiling of iN cells.
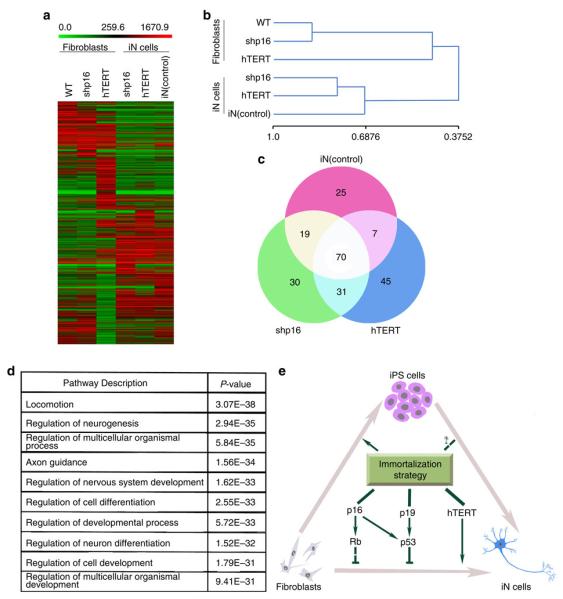
(a) Heat-map of genes differentially expressed in global RNA-microarray analysis performed on IMR90s (WT), IMR90 fibroblasts (expressing shp16, shp53 or hTERT) and iN cells (expression shp16, shp53 or hTERT and positive control (miRNA9-124 + Ascl1/Myt1l/Neurod2)). (b) Hierarchical clustering. The numbers generated by MeV software represent the correlation among different samples. The bigger number represents the more similarity of the expression profiles among samples. (c) General degree of overlapping expression among the three cell populations analysed. To pick threefold-changed genes of the microarray data, 40–55% of genes (70 genes) from three iN groups showed the general degree of gene expression overlap. (d) Alterations of relevant pathways from Ontology data base in iN cells (shp16, shp53 and hTERT). (e) Schematic drawing of a proposed model for effects of immortalization on fibroblast–neuron conversion.