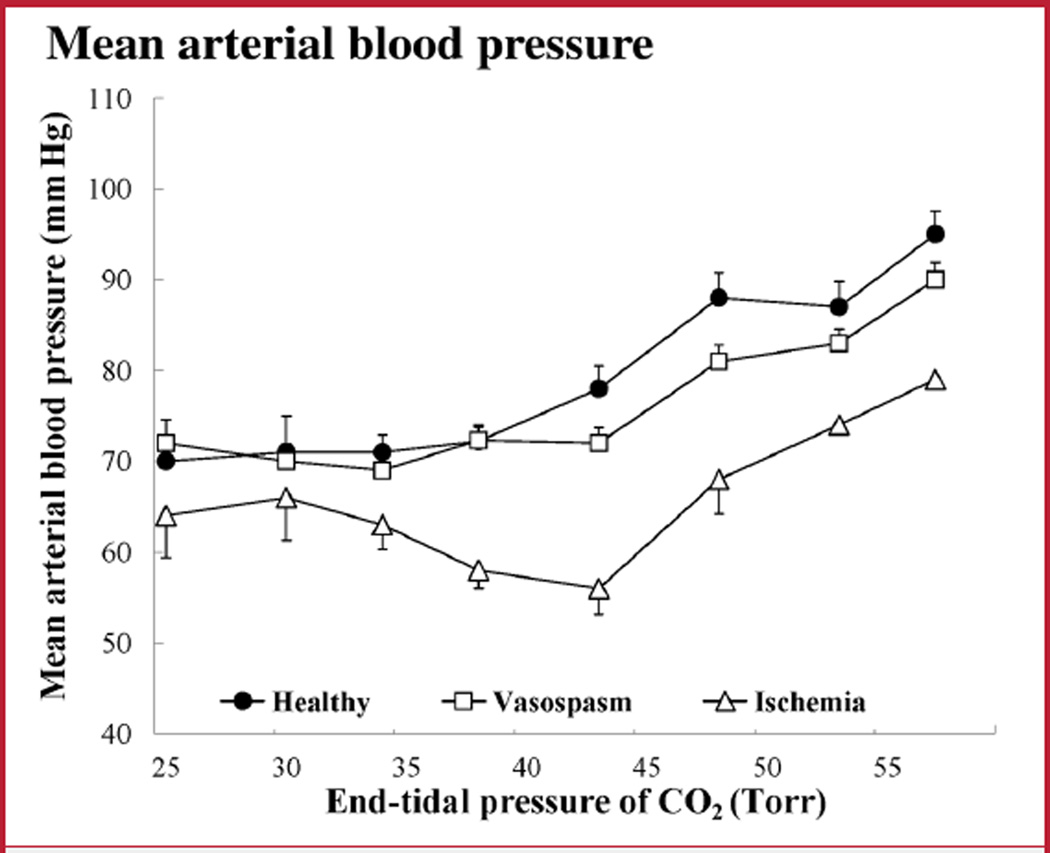
FIGURE 1.
Graph showing mean arterial pressure (MAP) values during changes in partial pressure of carbon dioxide (PCO2). The ischemia group had a significantly lower MAP (P < 0.001). However, MAP remained within the autoregulation range in all groups, and the general pattern of MAP changes attributable to changes in PCO2 was similar. Bars indicate mean ± standard deviation (SD).

