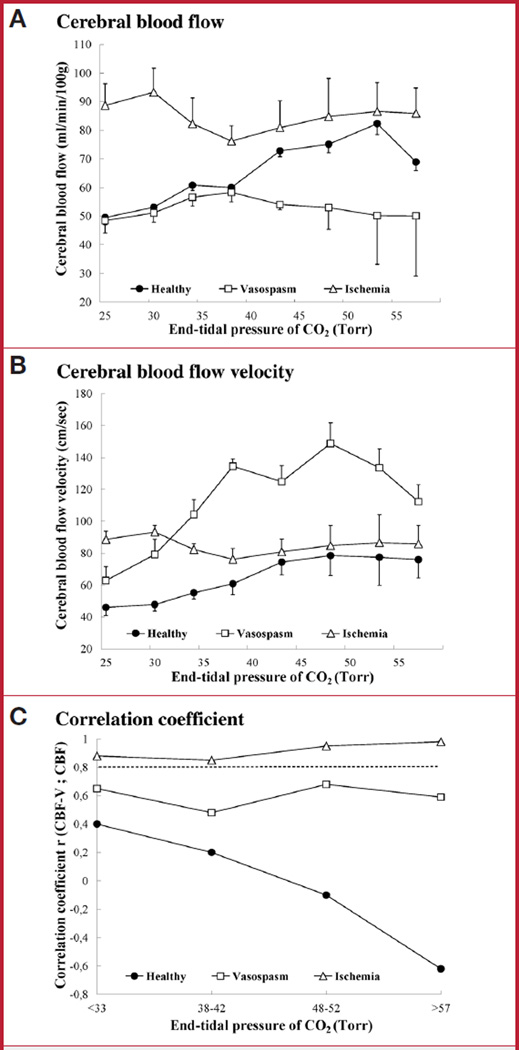
FIGURE 2.
Changes in cerebral blood flow (CBF), CBF velocity (CBF-V), and their correlation during chemoregulation. A, CBF during changes in PCO2 in control animals (n = 9, filled circles), animals with vasospasm (n = 4, open squares), and after ischemia (n = 3, open triangles). B, CBF-V during changes in PCO2. C, correlation between CBF and CBF-V during changes in PCO2. Correlations above 0.8 are considered strong (dashed line). Only postischemic animals maintained a strong correlation of CBF-V and CBF throughout the wide range of PCO2 changes. Number of measurements: control animals, n = 153; vasospasm, n = 106; global ischemia, n = 43. Bars indicate mean ± SD.

