Fig. 2.
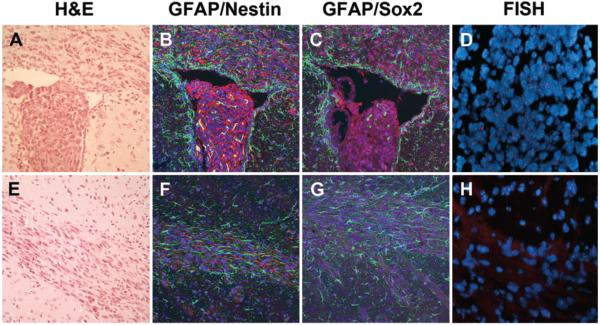
Xenograft tumor-initiating cells showing an infiltrative phenotype and stem cell markers in mouse brain parenchyma. A–D: Intraventricular injection of tumor-initiating cells. H & E staining of a brain section showing that the intraventricular cells maintain a neurosphere morphology. A portion of cells demonstrate a radial-glial morphology at the ependymal surface, suggesting invasion (A). Immunofluorescence staining for GFAP (green) and Nestin (red) showing Nestin-positive staining within the intraventricular tumor-initiating component as well as cells within the corpus callosum. The intraventricular cell component is negative for GFAP while cells along the ependymal surface and within the corpus callosum stain intensely for GFAP (B). Immunofluorescence staining for Sox-2 (purple) and GFAP (green) showing a similar pattern (C). Fluorescence in situ hybridization (FISH) analysis of the intraventricular cell mass confirming the human origin of the tumor-initiating cells (red staining for human X chromosome) (D). E–H: Tumor cells within the corpus callosum. H & E staining of a brain section showing high cellularity within the corpus callosum, away from the site of injection, suggesting the presence of tumor cells (E). Immunofluorescence staining for GFAP (green) and Nestin (red) showing the presence of Nestin- and GFAP-positive tumor cells within the corpus callosum (F). Immunofluorescence staining for Sox-2 (purple) and Nestin (green) showing a similar pattern (G). Fluorescence in situ hybridization analysis of the tumor cells confirming their human origin (red staining for human X chromosome) (H). Original magnification ×10 (A–C), ×20 (D), ×10 (E–G) and ×20 (H).

